Het project ‘My air, your air ‘ van Stadslab Luchtkwaliteit deelnemer Kirsten Kentler is een visueel onderzoek om vorm te geven aan de menselijke ervaring van Fij Stof.
“Are particulate matter data correspond to the experience of the air? What are the stories behind the data?’My air, your air’ is an exploration about how people worldwide are aware about air quality and which impact it has on daily life.
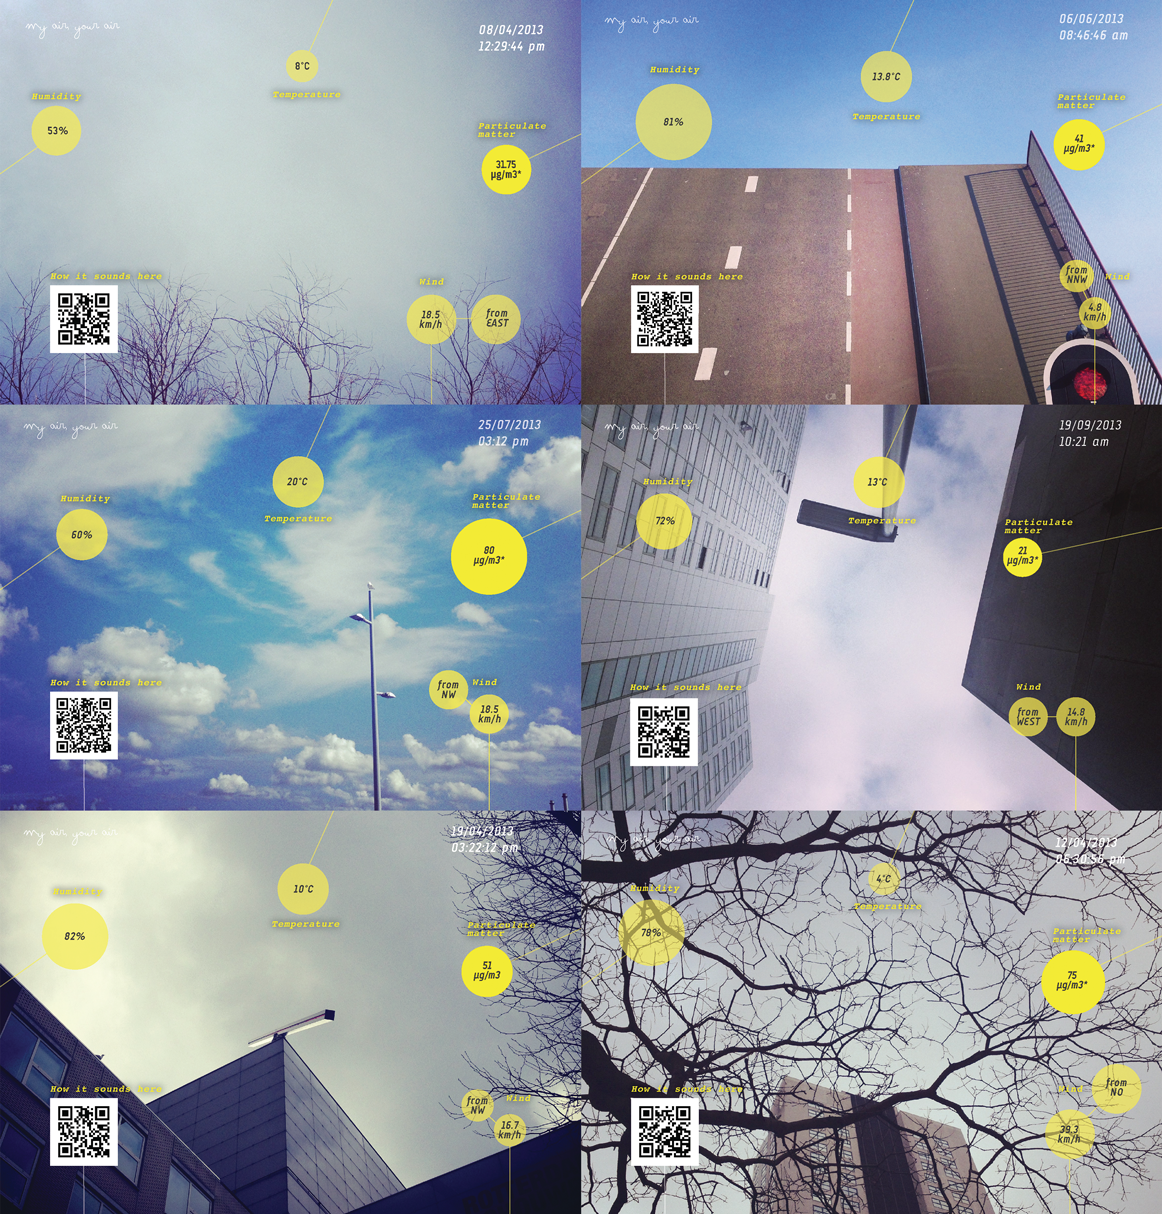
The research of the project started with making data-visualization postcards.
Through postcards I made some data of my living environment visible. On every front of the postcards are the following data:
- A picture in aerial perspective of the place where I am
- Sound of location (by placing an qr-code on the card)
Further the postcards contain data that a system continually harvest from the Internet and saves them in the ‘My air, your air’ database:
- Date and Time
- The highest value of particulate matter (PM10) of 10-12 measuring stations in Rotterdam*
- Wind direction and speed
- Humidity
- Temperature
*source: Landelijk Meetnet Luchtkwaliteit & Luchtmeetnet DCMR


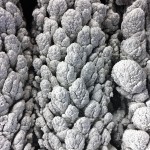
The back of the postcard is a metaphor for a volume of more than 120 μg/m3 of particulate matter. On the back is a data visualization depending on the highest value of particulate matter of one of the ten measuring stations in Rotterdam of the hour when the picture was taken.
On the postcard were little stories written. Here is an example:
At 5:26:12 pm the current highest PM10 value in the Rotterdam region is 129 µg/m³ which is very unhealthy for sensitive groups. Like every day the old lady shuffling with her dog through the streets. At any time, in any weather. The afternoon ended with a light wind of 10 km/hour from southwest. It’s 13.0 °C and the air is humid with 80%. She always sees a lot, but today she can not answer who left the deep scratches in the parked cars in front of the house.”
When the particulate matter value was high there was little space to write a story on the back of the postcard. At low levels there was enough space to put a long story on the back of the postcard.


Received postcards
For the project ‘My air, your air’ the network post crossing was used. For every postcard that was send from Rotterdam into the world, one postcard came back from different international places. The aim of the postcards was to collect stories about the perception of the worldwide air living space.On the post crossing network profile the following questions were placed:
- Are you conscious about the air quality where you live?
- Do you have the feeling that the air has a good / bad quality where you live?
- Has it effect on your life?
- What means clean air for you?
- Do you think that your city/region has a lot of particulate matter?
- Are you curious about the air values of your city/region? And do you have the possibility to check the air values of your city/region?
Some conclusions
Here are some findings that attracted our attention.
• All postcards from Taiwan say that they feel or see, that the air in their country is very poor.
• Postcards from people who are living outside the city are convinced that the air is better in their region.
• Some postcards from people say that the air is better on holiday or abroad.
Every time when I received a postcard I’ve checked out the values in the city/country the postcard came from. Unfortunately the data of particulate matter is not in all countries publicly available.
A friend of mine went to China for a while. When she travelled for some days from the north of china to the coast she was convinced that she better could breath and that the air was better there. When I’ve verified the values on the day I received her postcard, the opposite was the case. The values were much higher at the coast than in the northern part of China. This were the exactly values:
Běidàihé, Qinhuangdao/China:
173 µg/m³* – UNHEALTHY
Benxi/China:
51 µg/m³* – MODERATE
*source: aqicn.org
She wrote on the postcard:
It’s really a relief to be here and breathe fresh air, instead of breathing air full of dust in Benxi.


Even this was just a snap-shot-method, the difference between perception and facts of values was very surprisingly.
Another example – a girl from Taiwan wrote me that the air on holiday in China and Japan was better than in her hometown. Also in this case the opposite was true.
We have to compare the values for a while to confirm this assumption. During my research I’ve figured out that the values are depending on weather and landscape conditions. The values are also determined by wind direction/speed, humidity and how flat or mountained the landscape is. Natural areas have no carte blanche for high PM values. On the contrary – to example in mountainous American natural areas like Yosemite, the amount of particulate matter is sometimes concentrated and cannot move. A natural phenomenon such as fog in nature, which we regard as naturally and aesthetic is nothing but more than a high concentration of particulate matter.
Our first conclusion:
On the one hand people’s perception of bad air corresponds very well to the actual air quality data. Then we talk about very high particulate matter values in long periods in urban environments like in Asia.
On the other hand it seems that the association with clean air in combination with nature or an environment abroud is has more influence on the perception of air quality. At this point the perception does not correspond with the particulate matter values.”